CRIME
INFORMATION
CRIME INFO
CRIME REPORTS
We are pleased to provide an option to search preliminary crime information. The tool offers a search functionality, as well as unique features, insuring you receive the latest information.You will be leaving the Cheektowaga Police Department website for the following site. CrimeReports
- View crimes near an address, as well as within a specific boundary
- Select from a template of crime types
- Enhance our community-oriented policing efforts by keeping ourcitizens and business owners well informed
- View Registered Sex Offenders
- See neighboring participating cities data
- Includes iPhone application.
The tool has an alerts system that will allow residents and business owners to receive email alerts regarding recent incident activity in their desired area. The e-mail alerts contain a report outlining what type of incidents occurred, as well as when and where they occurred. The e-mail alert will also contain a link directly to the on-line mapping application that depicts the results of the requested query.
Online Accident Reports
The Cheektowaga Police Department has launched its new online system for the public to obtain motor vehicle accident reports and accident photographs. Accident reports on-line are generally available within 5 business days of the accident date.
Note: Accident photos are not taken at the scene of every accident.
For a $5.00 fee you can obtain a copy of the accident report.
Photographs are available for $4.00 a photo.
You can go direct to the site HERE
Visit our FAQ page for more information.
Additional Crime Information
The Cheektowaga Police are utilizing a web service to post crime statistics on the internet.This data is LIMITED and does not represent all crimes or reports in the area.Visit the SpotCrime Website for your neighborhood crime information.
Department Crime Stats:
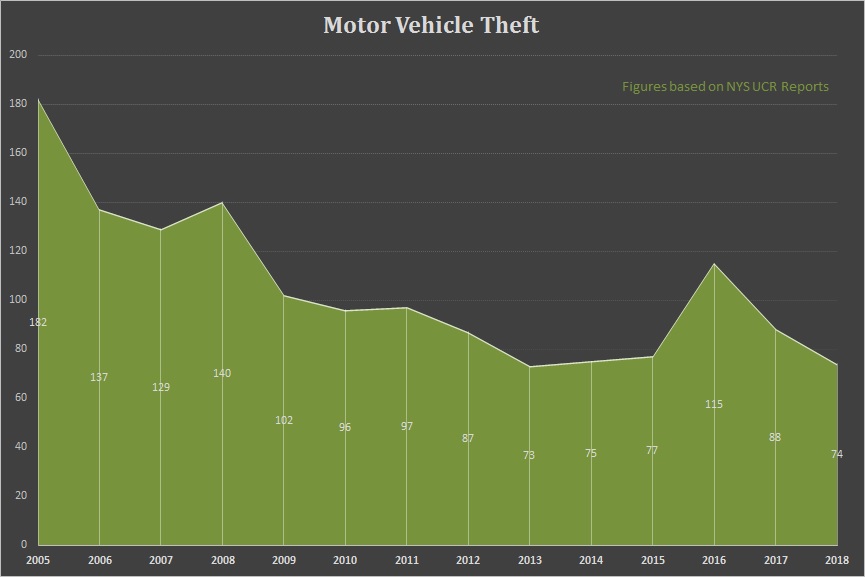
NYS UCR Reports
ATMs
Be Prepared
Child Safety
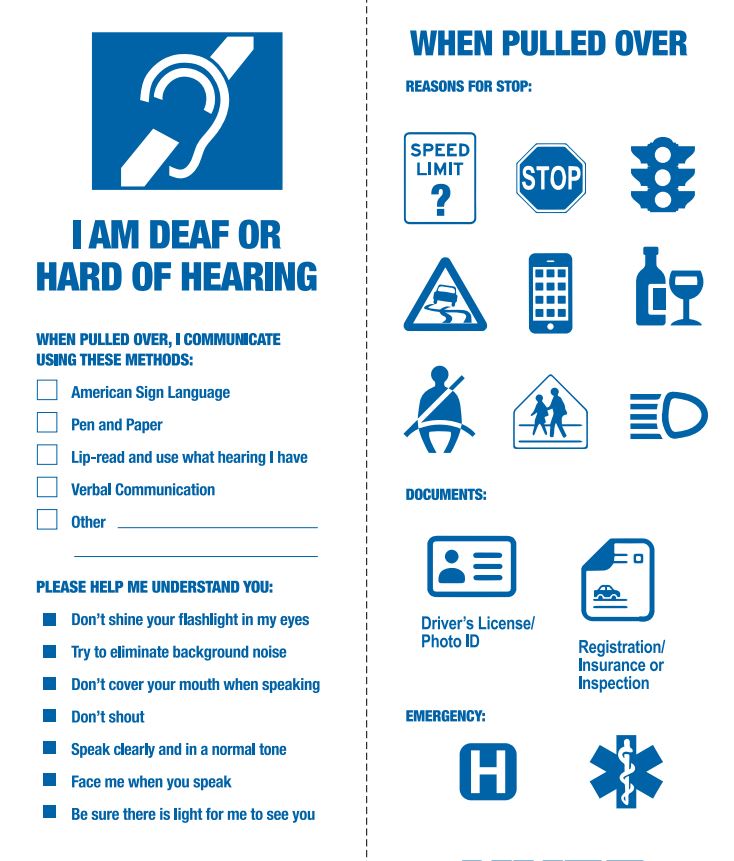
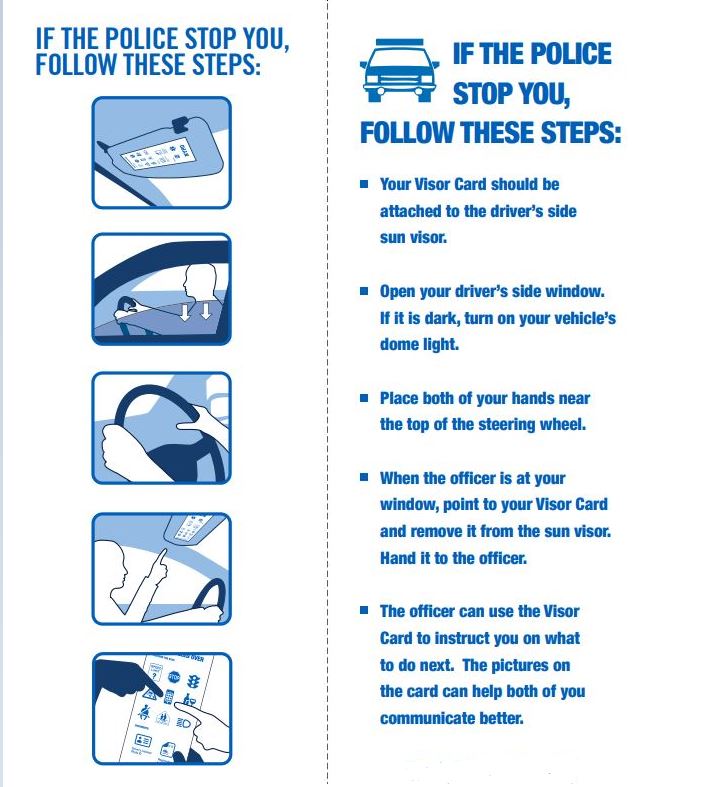
Disability
Domestic Violence
- Keeping your Family Safe
- How the Police Can Help
- Stalking
- Teen Dating Violence
Home/Apartment
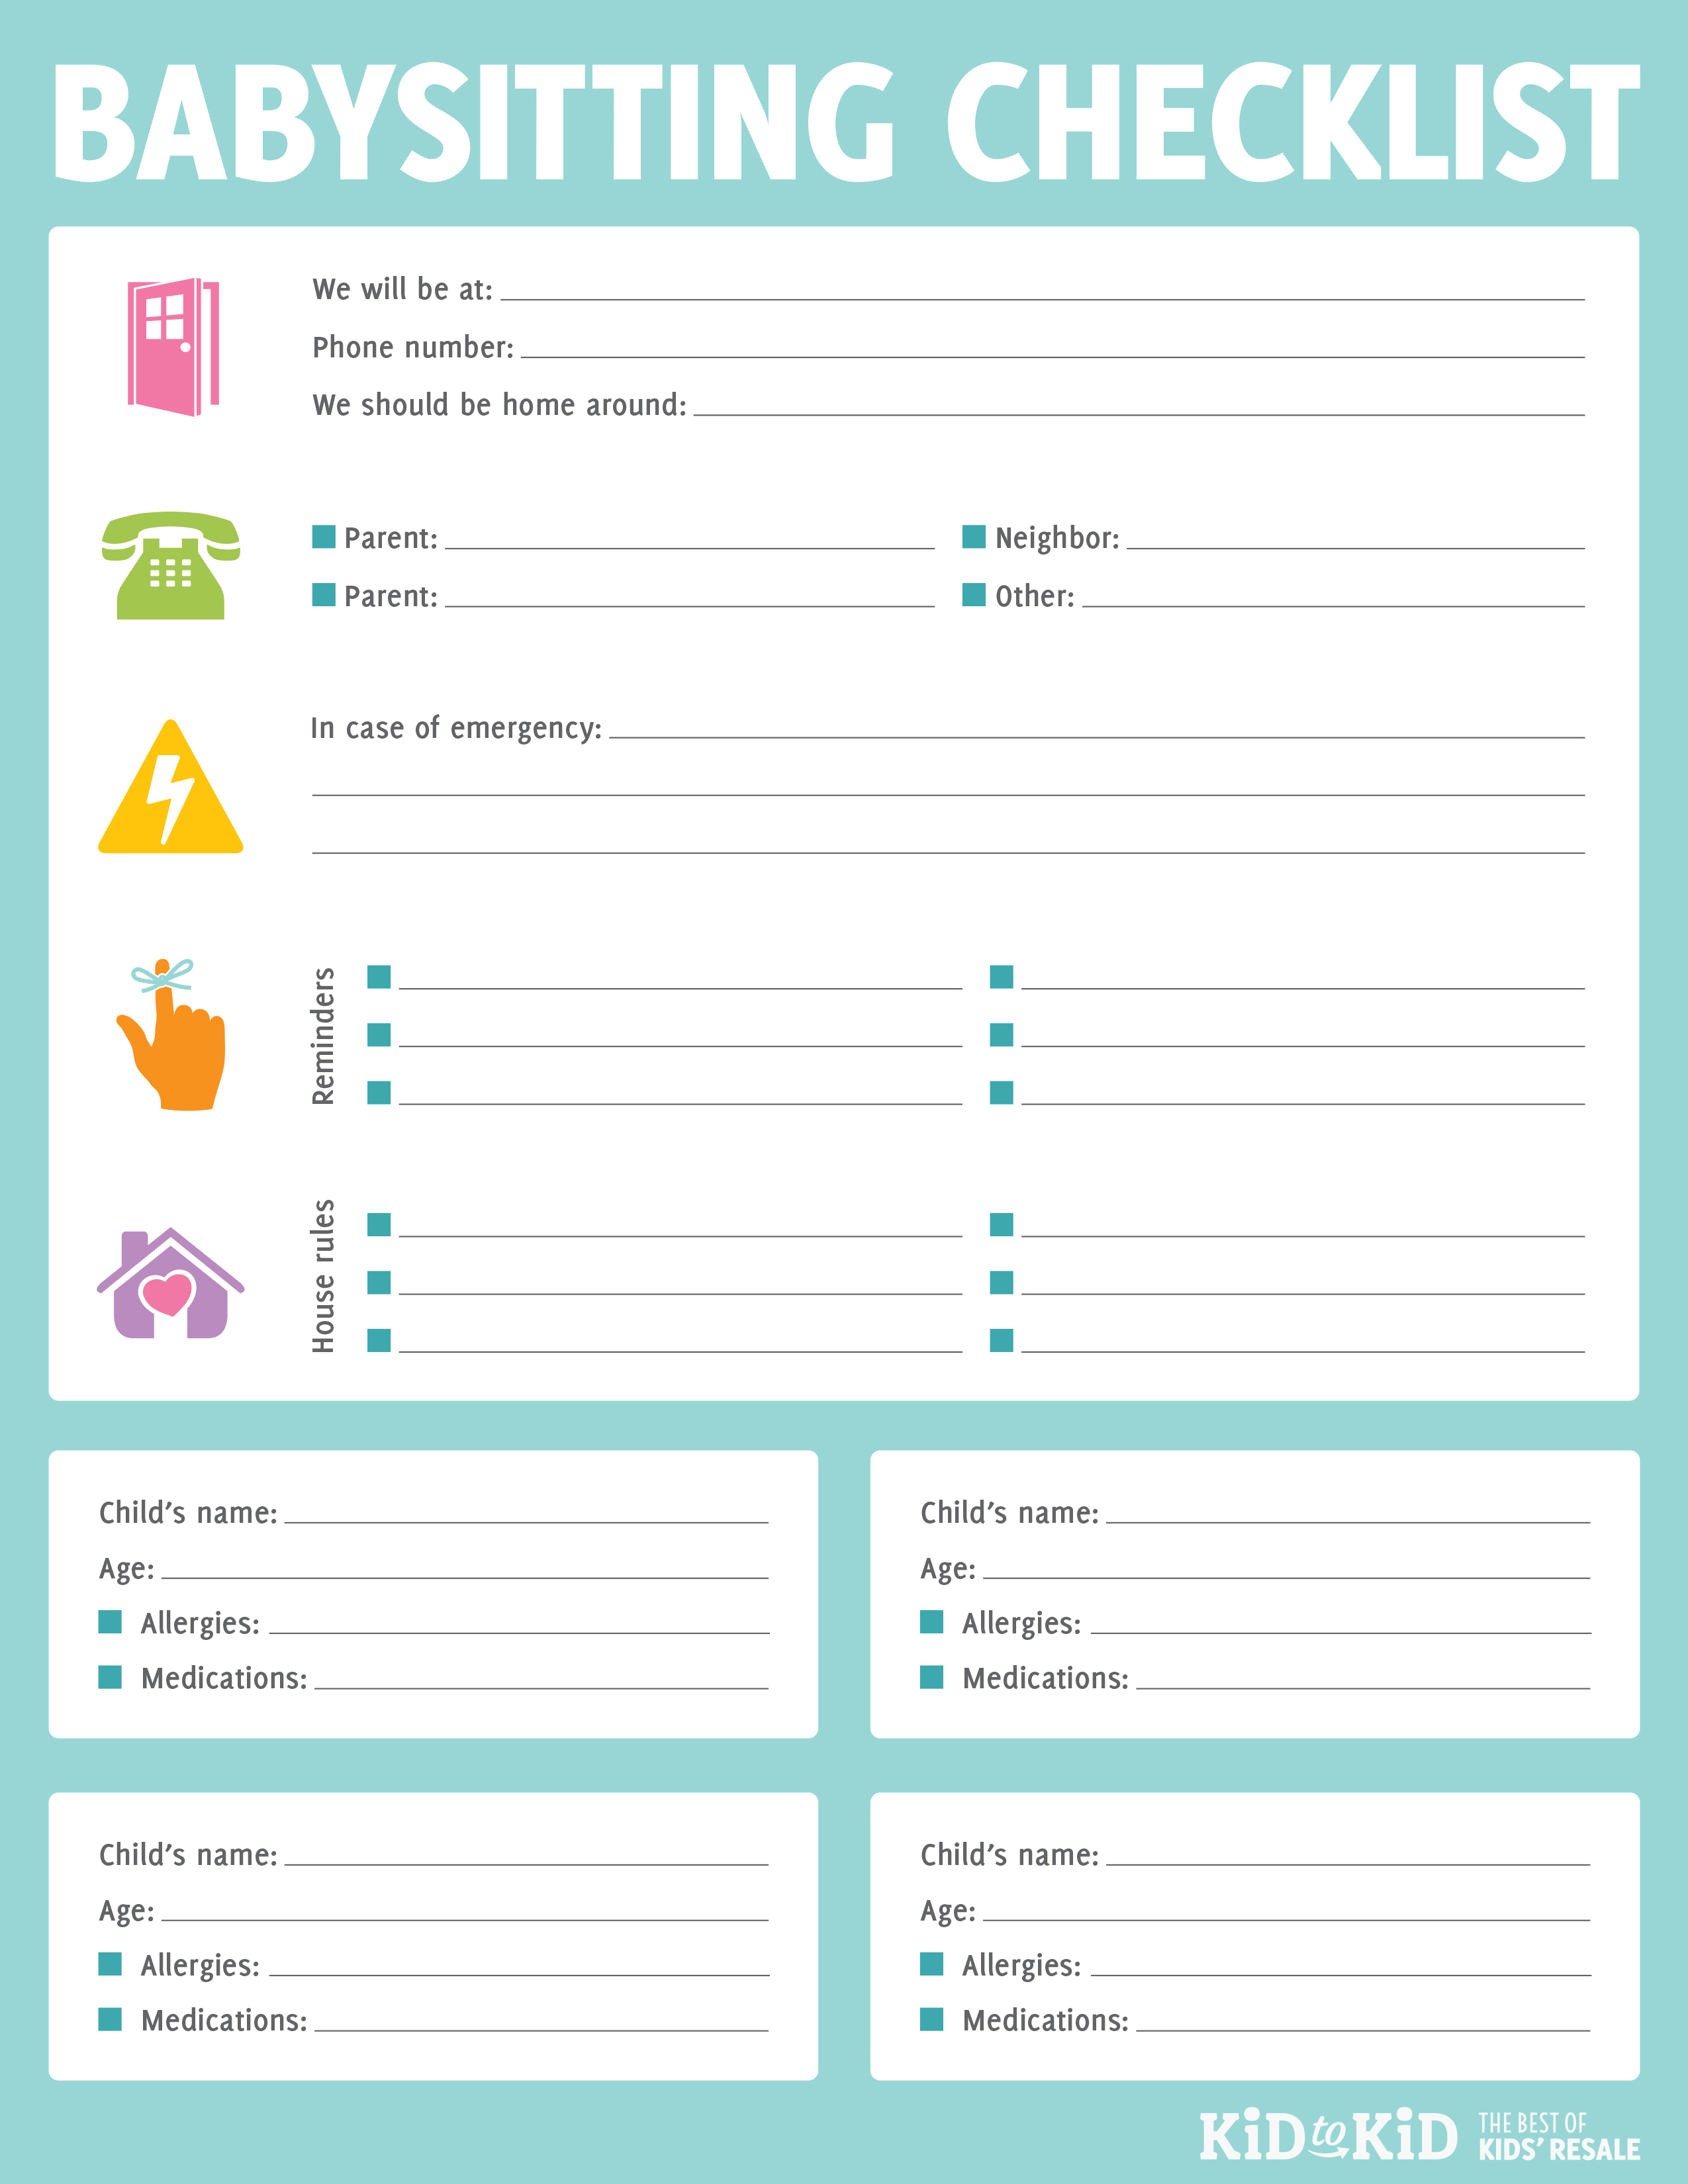
- Babysitting Checklist
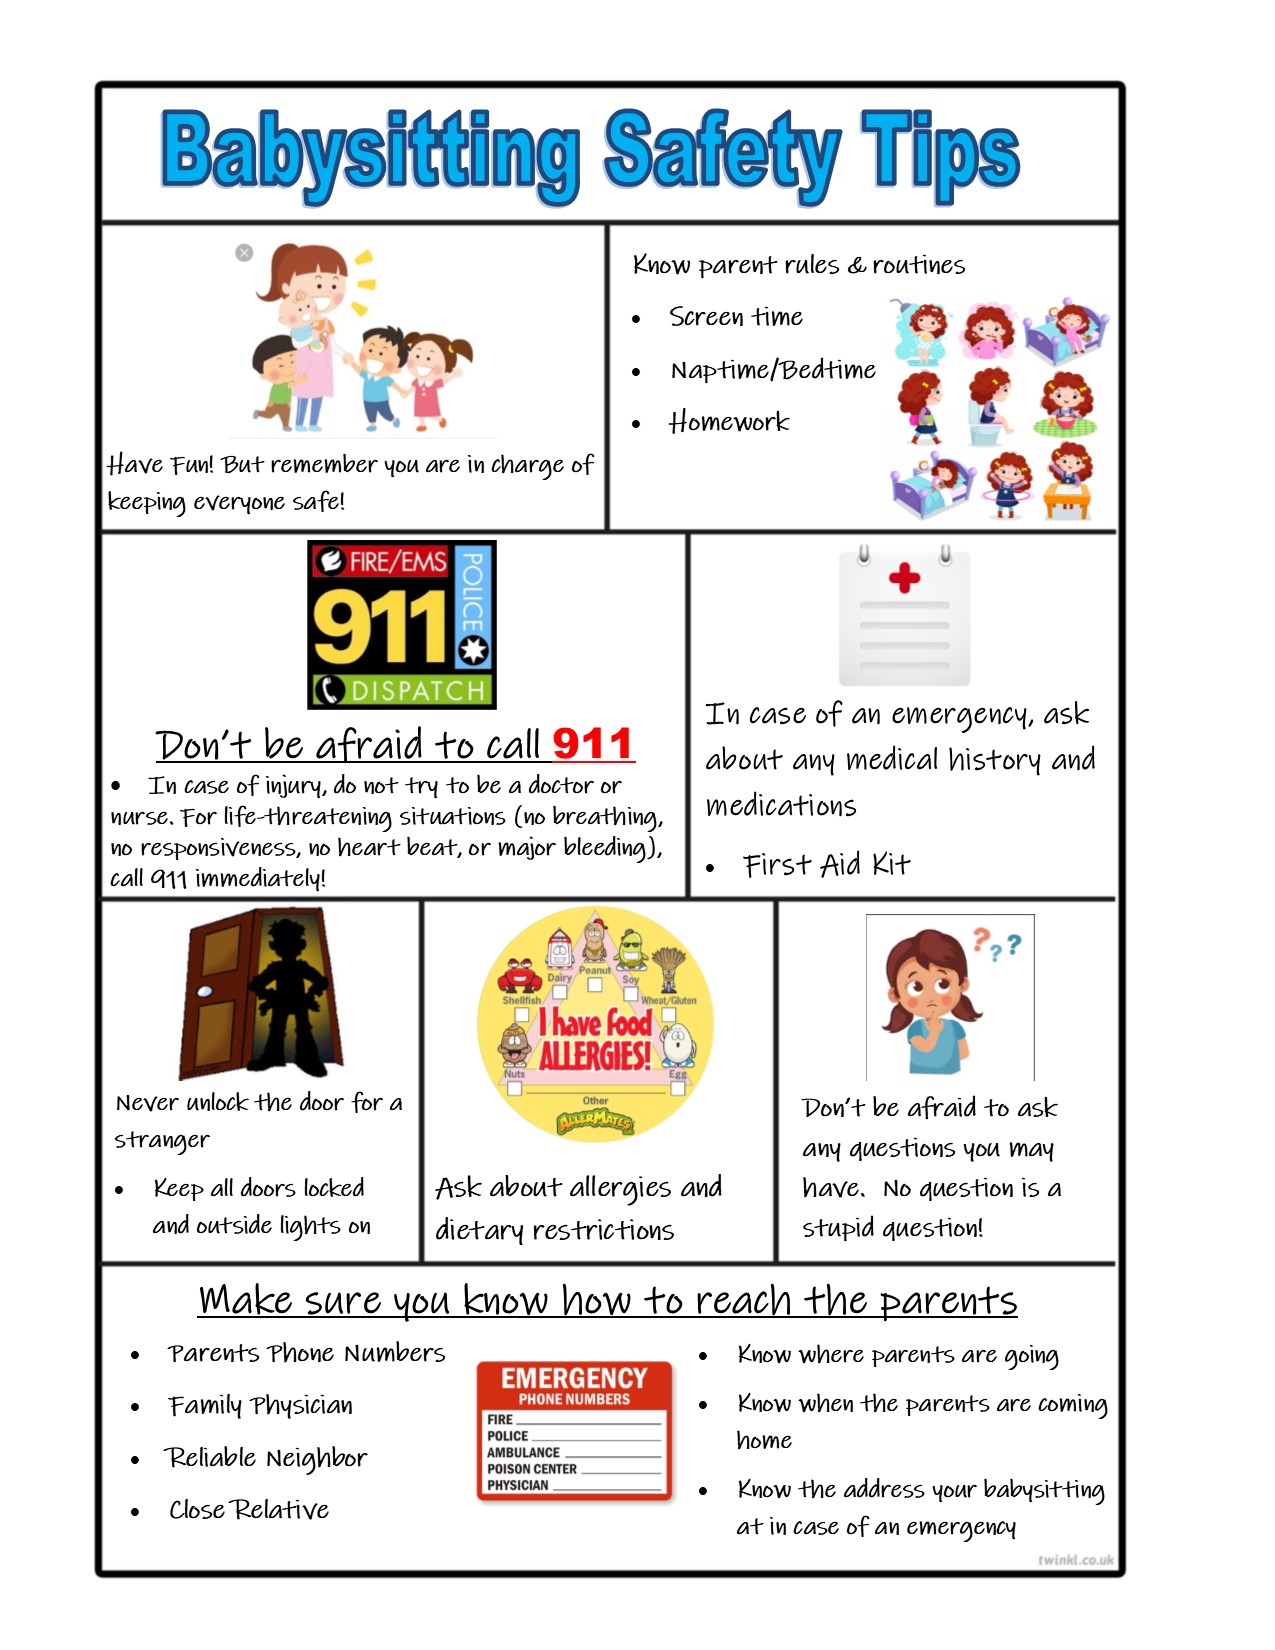
- Babysitting Safety Tips
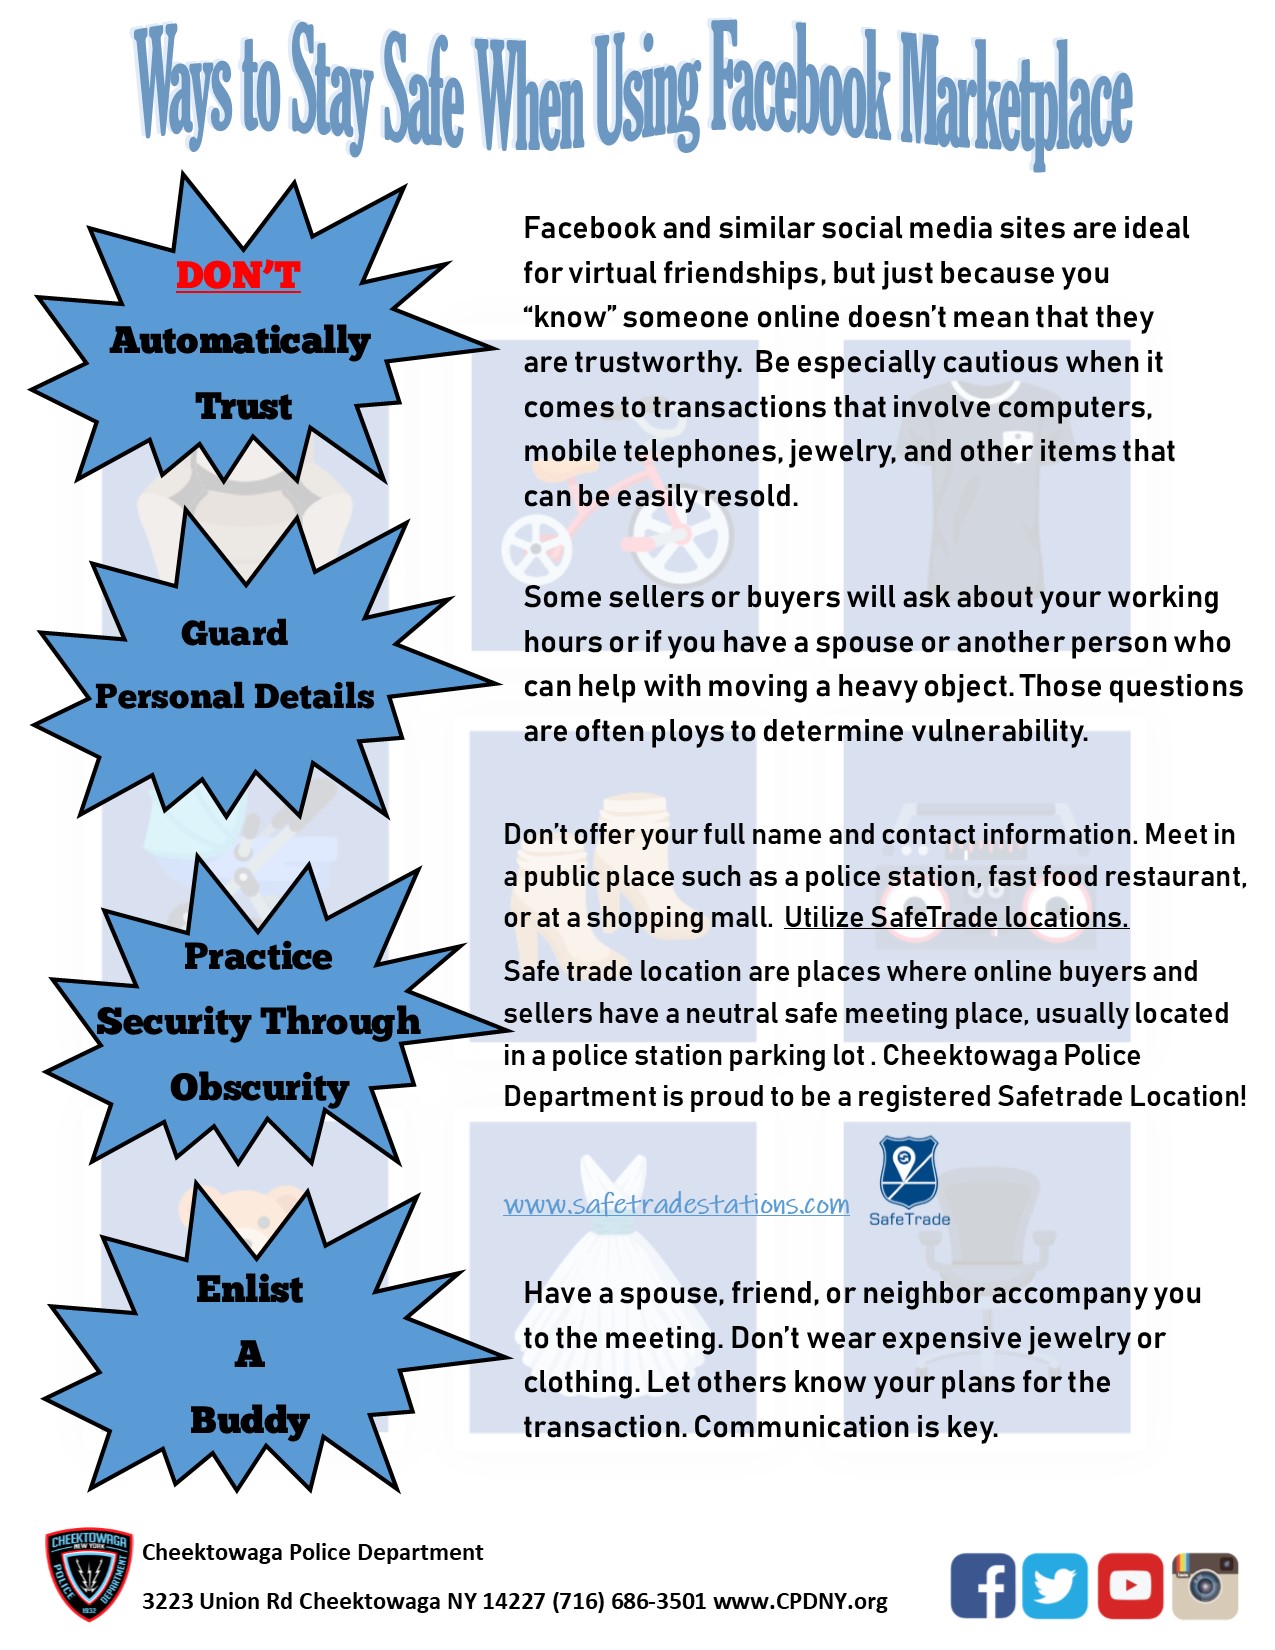
- Facebook Marketplace
- Safeguard your house
- Safeguard your apartment
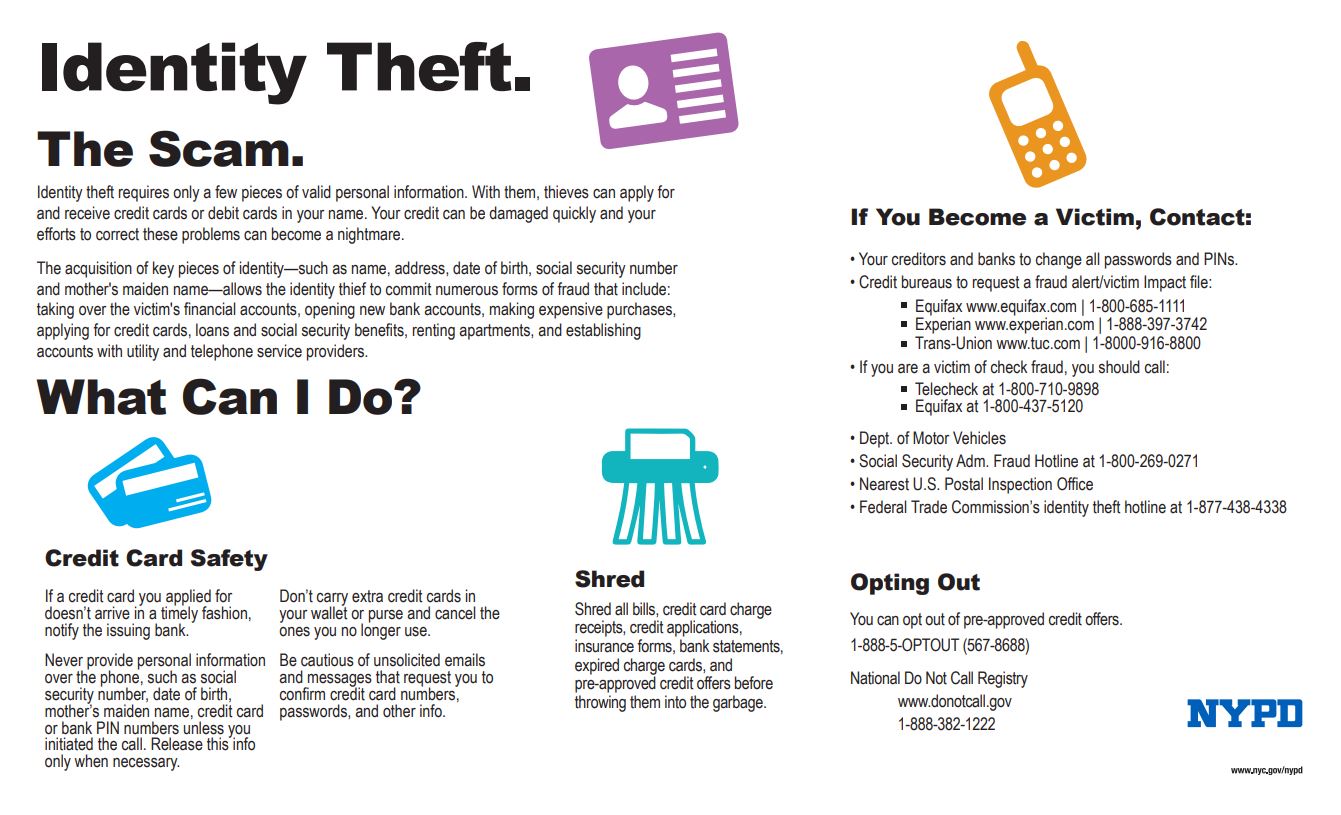
- Identity Theft
Identity Theft
Personal Safety
- File of Life
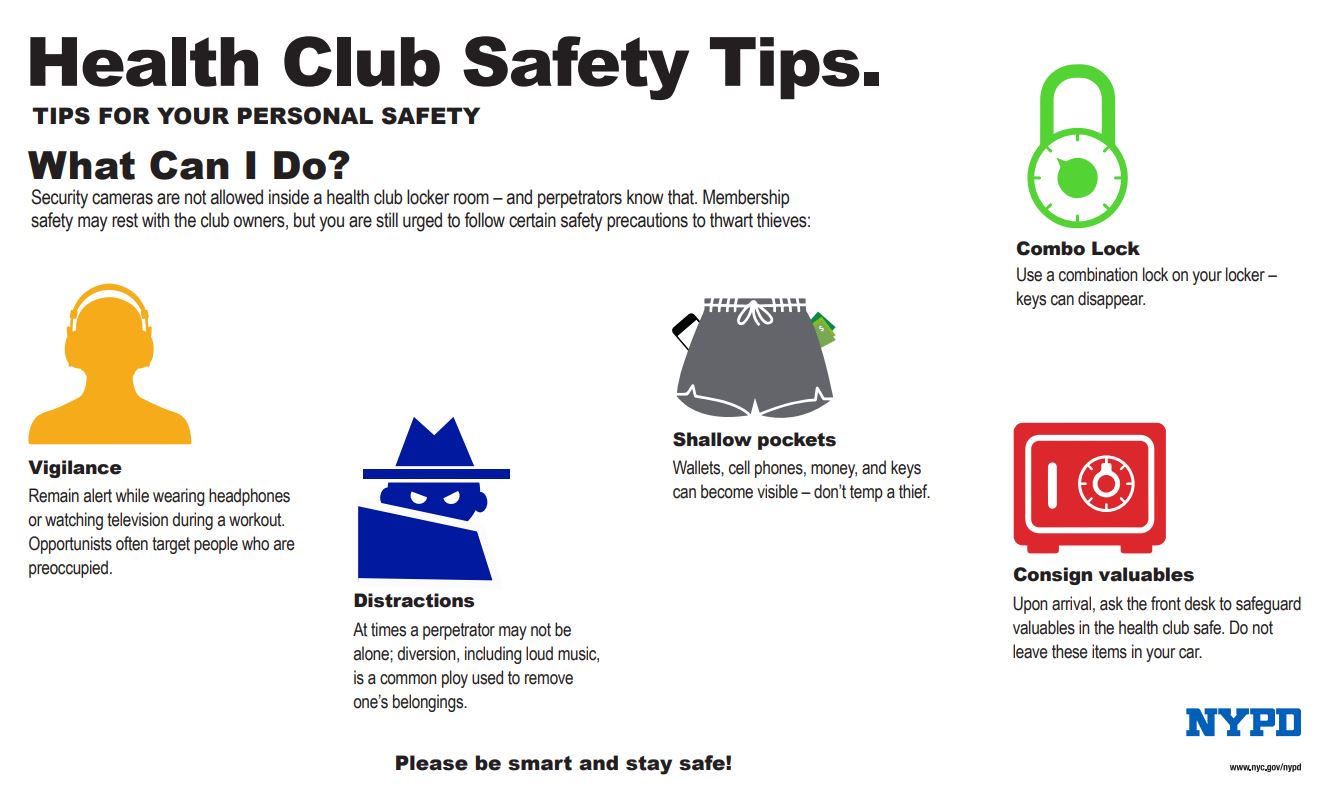
- Health Club Safety
- Phones/Social Media
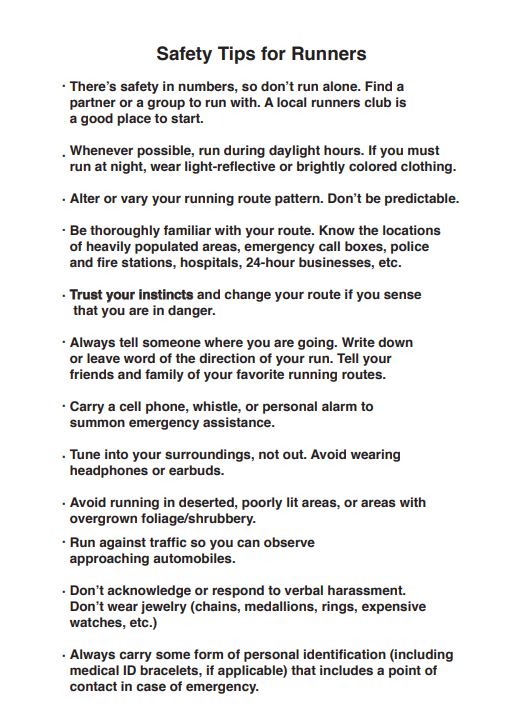
- Run Safe
- Watch Your Watch
Public Transportation
- Subway and Bus
- Transit Safety
Scams/Fraud
- Chinese Phone Scams
- Green Dot Cards
- Mailbox Fishing
- Mailbox Fishing – Tax Returns
- Prepaid Gift/Debt Cards
- Rental Listing Scam
Seniors
- Keeping Seniors Safe
Vehicles/Driving
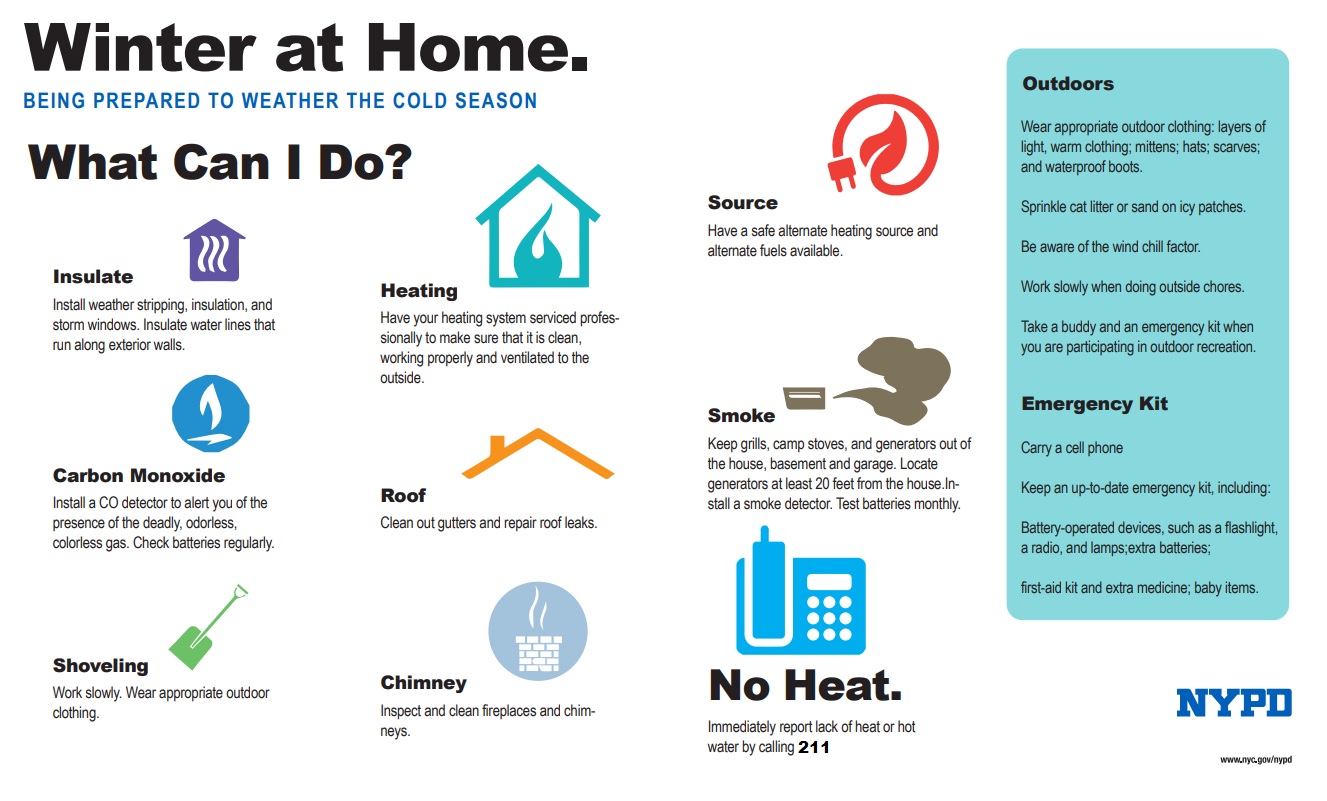
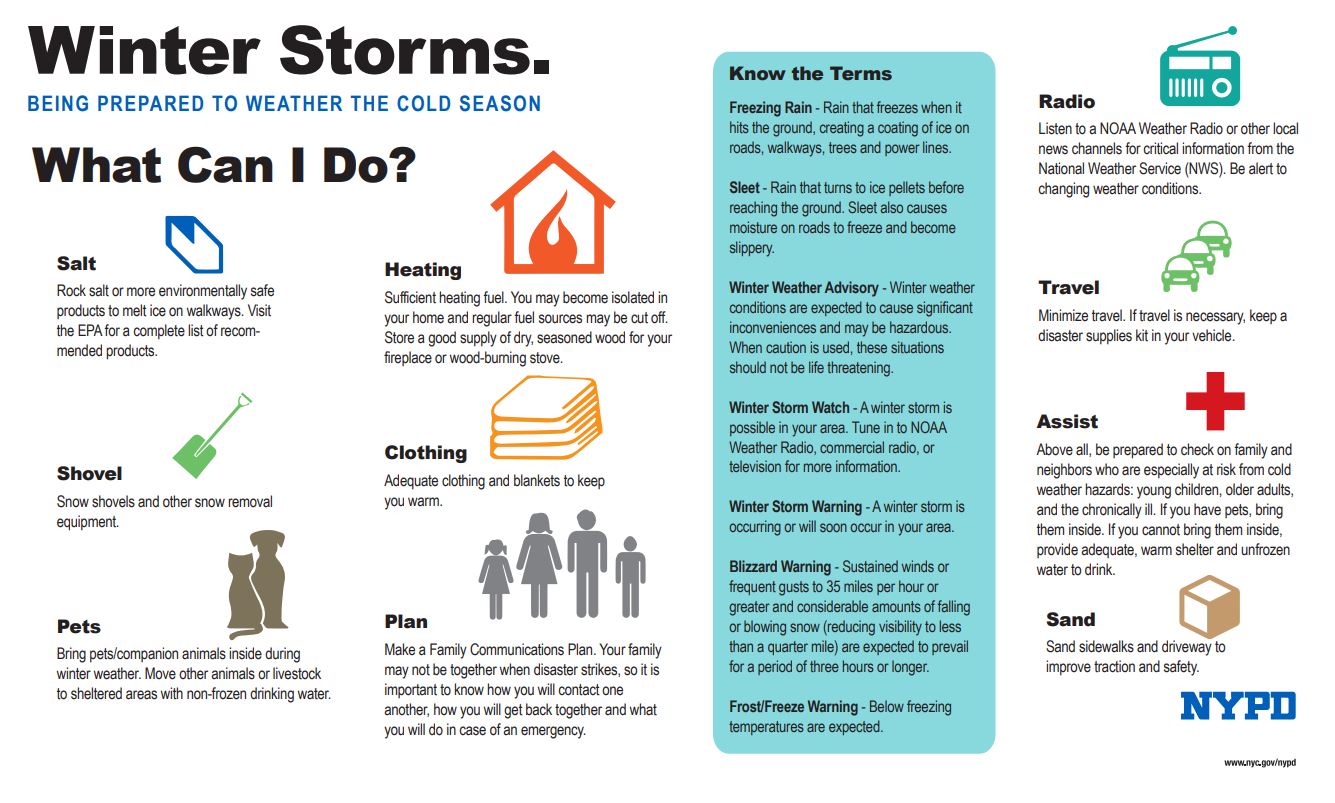
Weather-Related/Seasons
LONGTERM DEPARTMENT STATS

BUFFALO STATE USE OF FORCE
The basic arrest data for years 2009-20012 are shown below in Table 1. A Chi-square analysis of the proportion of arrests involving UOF (i.e. UOF Incidents/Total Arrests) showed that there was an overall significant difference across all four years ( χ2(3)=49.8, p < 0.001), and separate z-tests were subsequently carried out on selected pairs of proportions to determine the source of the difference. These analyses showed that there was a large decrease between 2010 and 2011 (0.030 vs. 0.015, z=5.056, p < 0.0001 one-tailed) and that decrease remained stable through 2012 (0.015 vs. 0.013, z=1.067, p > 0.05, two-tailed.) Moreover, of the two years under the new training system, the higher rate of arrests involving UOF in 2011 was also significantly lower than the smaller rate under the old system in 2009 (0.015 vs. 0.023, z = 2.984, p < 0.01, two-tailed.)
Table 1. Number and incidence of calls, arrests and UOF incidents by year
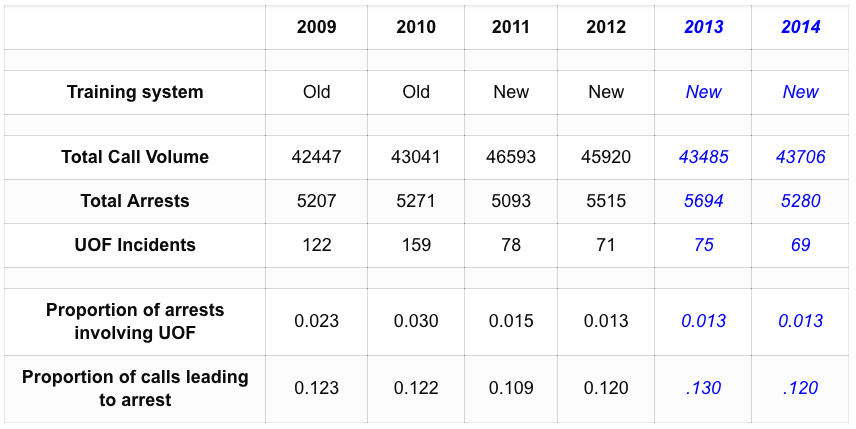
In evaluating these results, a critic might argue that the observed decrease in UOF could also be attributed to differences in the total number of arrests and/or the call volume that occurred during the years the new system was implemented. An examination of these values in Table 1 suggests that 2011 had the lowest total number of arrests of the four years under consideration, implying that the drop in UOF arrests in 2011 could simply be due to the fact that there were fewer incidents requiring an arrest. A Chi-square analysis showed that there was an overall difference in the proportion of calls leading to arrest (i.e. Total Arrests/Total Call Volume) between 2009-2012 ( χ2(3)=52.4, p < 0.001) and a follow-up z-test showed that the proportion of calls leading to arrest in 2011 was significantly lower than the next lowest rate, which occurred in 2012 (0.109 vs. 0.120, z = 5.151, p < 0.0002, two-tailed). However, the fact that the proportion of calls leading to arrest in 2012 recovered to the same level that it was in during 2009 – 2010 suggests that the unusually low number of arrests in 2011 may have been an anomaly, and that the stability of the decrease in the proportion of arrests involving UOF from 2011-2012 under the new training system, is the more important finding. The fact that 2011 had such a dramatic decline in arrests involving UOF even though it also had the largest call volume suggests that the new training system may have compensated for the added stress that the police were under in responding to incidents.
Additional support for the idea that the new training system influenced the decrease in UOF arrests can be found by examining all of the specific type of force events that had complete data over the four years under consideration, as shown below in Table 2. These results indicate that overcoming physical resistance was the most frequently used method across all four years, while personal weapon was the least common. However, these two methods were not subjected to further analysis because of two major statistical considerations: (1) Because police departments typically quantify use of force in terms of the total number of incidents in which force is needed to effect an arrest (without taking into account the number of officers and the number of different force events involved in a particular incident) overcoming physical resistance would produce several yearly proportions greater than one, and (2) personal weapon did not have enough data to support any kind of statistical test, even at an exploratory level. The resulting proportions for each force event relative to the total number of UOF incidents in that year is shown below in Table 3.
Table 2. Number of each force event used across all UOF incidents by year
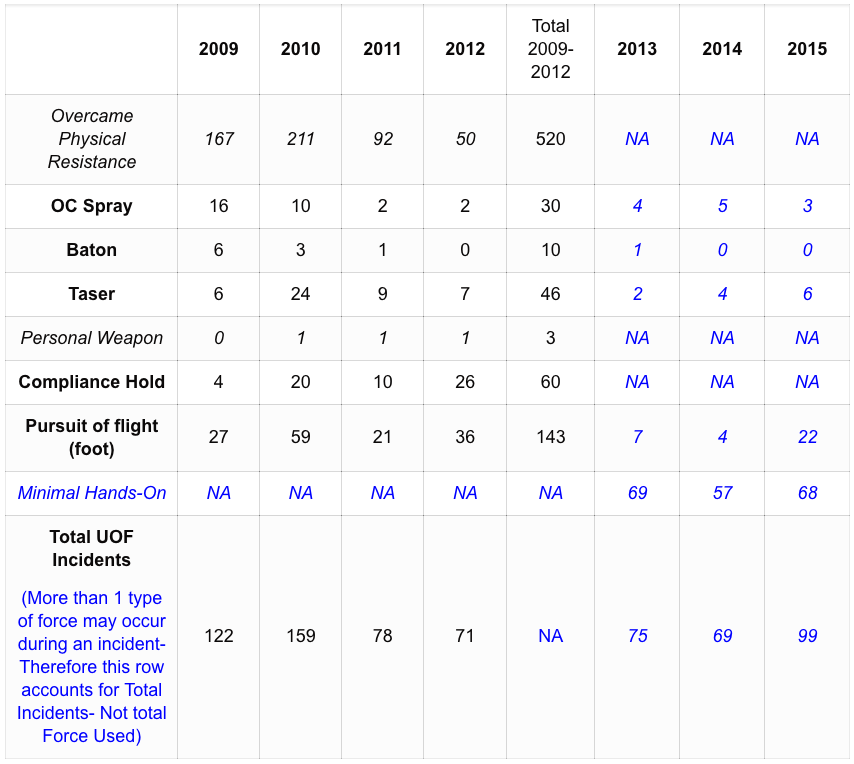
** All Data in blue is NOT part of the original study, and was added after the fact using the same standards as the original study.**
In 2013, the use of force monitoring was further refined to include the category (minimal hands on) which better documents any minor use of force which required and officer to put his hands on a subject to gain compliance. An example would include grabbing a suspects arm/wrist to handcuff a subject that wasn’t complying with verbal commands.
Table 3. Proportion of each force event used relative to total UOF incidents by year
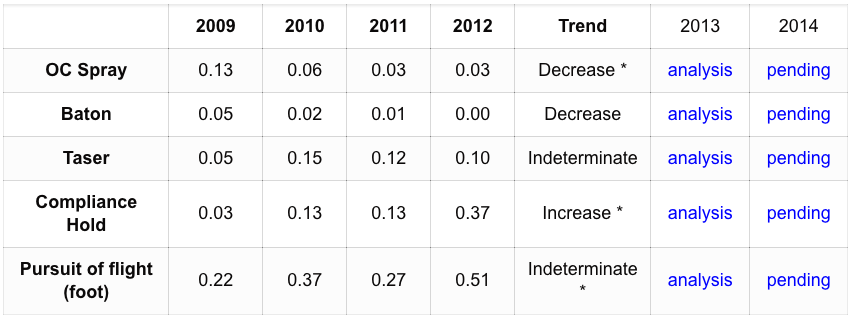
* Indicates trend was significant using a two-tailed test
A Chi-square analysis was carried out on each of these five force events and the results showed a significant difference for OC Spray ( χ2(3)=11.431, p < 0.01), pursuit of flight ( χ2(3)=19.012, p < 0.001), and compliance hold ( χ2(3)=42.293, p < 0.001), but not for baton ( χ2(3)=5.809, p = .121) or taser ( χ2(3)=7.593, p = 0.05). Given the small number of counts in many of the cells, follow-up z-tests were not performed and so the resulting trends should be viewed as preliminary in nature. However, there is at least some evidence that the use of OC Spray has decreased as a result of the new system while the use of compliance hold has increased.
–end of report summary–
2015 DEPARTMENT STATS
Year to date, CPD has had numerous “saves” from Naloxone administration. Other stats below indicate various metrics of Department activity.
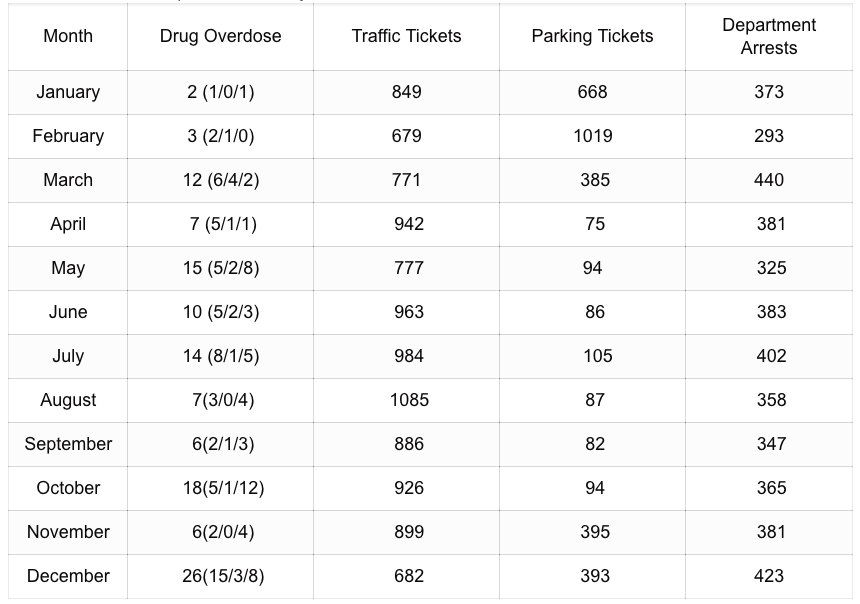
Drug Overdoses listed are followed by 3 numbers in parenthesis. Such as (6/4/2) The first column is NARCAN administered by Police. The Middle number is NARCAN Administered by EMS. The last number is No Treatment Indicated. Therefore, 6 NARCAN by CPD, 4 NARCAN by EMS and 2 Persons who did not require NARCAN. * Indicates data that is manually entered into the Records Management Systems and therefore may not be up to date at this time. Department Arrests will include all crimes including Part 1, as well as Vehicle and Traffic offenses and local ordinance violations.
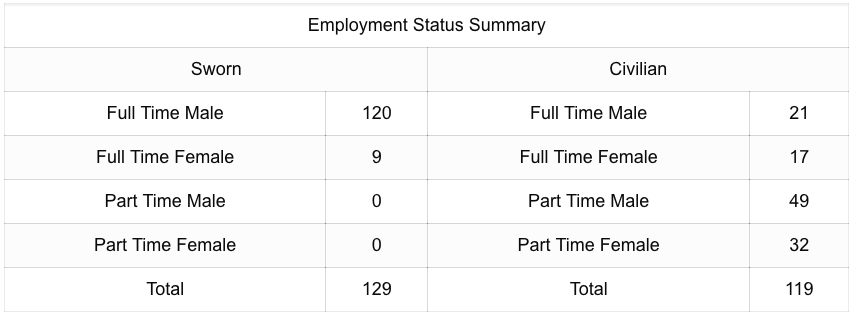
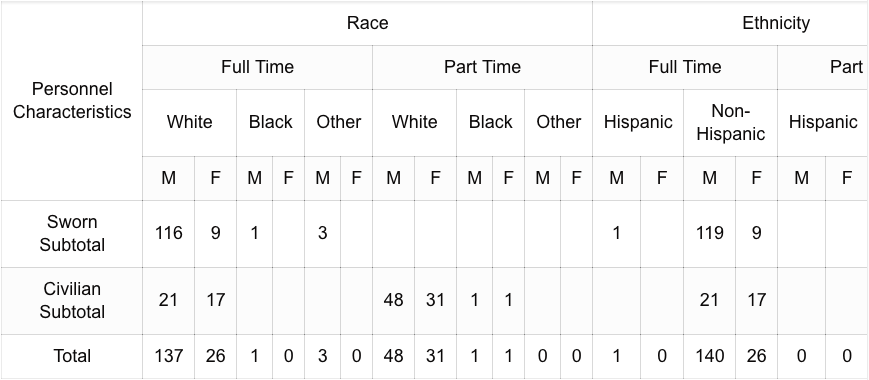
The Department Employment stats seen are required reporting to NYS Division of Criminal Justice Services. All NYS Agencies submit these statistics to NYS on an annual basis. The Cheektowaga Police Department runs an aggressive hiring campaign which includes reminding the general public regarding Civil Service Testing dates. As a Civil Service based agency, all Full Time hiring of Sworn Personnel requires that we follow the hiring provisions as set forth by Civil Service. For more information, please see our Employment Opportunities page.
2016 DEPARTMENT STATS
Other stats below indicate various metrics of Department activity.

Drug Overdoses listed are followed by 3 numbers in parenthesis. Such as (6/4/2) The first column is NARCAN administered by Police. The Middle number is NARCAN Administered by EMS. The last number is No Treatment Indicated. Therefore, 6 NARCAN by CPD, 4 NARCAN by EMS and 2 Persons who did not require NARCAN. * Indicates data that is manually entered into the Records Management Systems and therefore may not be up to date at this time. Department Arrests will include all crimes including Part 1, as well as Vehicle and Traffic offenses and local ordinance violations.

The Department Employment stats seen are required reporting to NYS Division of Criminal Justice Services. All NYS Agencies submit these statistics to NYS on an annual basis. The Cheektowaga Police Department runs an aggressive hiring campaign which includes reminding the general public regarding Civil Service Testing dates. As a Civil Service based agency, all Full Time hiring of Sworn Personnel requires that we follow the hiring provisions as set forth by Civil Service. For more information, please see our Employment Opportunities page.

2017 DEPARTMENT STATS
| Month | Drug Overdose | Traffic Tickets | Parking Tickets | Department Arrests |
| January | 16 (6/3/7) | 803 | 529 | 342 |
| February | 11 (3/1/7) | 919 | 185 | 338 |
| March | 13 (7/6/0) | 883 | 137 | 374 |
| April | 13 (5/6/2) | 934 | 68 | 292 |
| May | 9 (2/3/4) | 816 | 100 | 310 |
| June | 10 (6/3/1) | 988 | 92 | 360 |
| July | 9 (0/5/4) | 1003 | 108 | 355 |
| August | 6 (2/2/2) | 810 | 92 | 299 |
| September | 7 (2/2/3) | 700 | 119 | 305 |
| October | 9 (2/3/4) | 628 | 158 | 303 |
| November | 7 (2/1/4) | 806 | 201 | 303 |
| December | 1 (0/1/0) | 620 | 468 | 305 |
Drug Overdoses listed are followed by 3 numbers in parenthesis. Such as (6/4/2) The first column is NARCAN administered by Police. The Middle number is NARCAN Administered by EMS. The last number is No Treatment Indicated. Therefore, 6 NARCAN by CPD, 4 NARCAN by EMS and 2 Persons who did not require NARCAN. * Indicates data that is manually entered into the Records Management Systems and therefore may not be up to date at this time. Department Arrests will include all crimes including Part 1, as well as Vehicle and Traffic offenses and local ordinance violations.
2018 DEPARTMENT STATS
| Month | Drug Overdose | Traffic Tickets | Parking Tickets | Department Arrests |
| January | 4 (2,2,0) | 652 | 797 | 294 |
| February | 6 (1,3,2) | 776 | 564 | 257 |
| March | 8 (1,5,2) | 982 | 168 | 331 |
| April | 4 (2,2,0) | 803 | 193 | 273 |
| May | 11 (7,1,3) | 1030 | 178 | 305 |
| June | 5 (0,5,0) | 1038 | 118 | 295 |
| July | 3 (2,1,0) | 1445 | 157 | 345 |
| August | 5 (3,1,1) | 1449 | 107 | 340 |
| September | 5 (2,0,3) | 909 | 127 | 316 |
| October | 8 (3,2,3) | 911 | 191 | 298 |
| November | 2 (0,2,0) | 928 | 257 | 303 |
| December | 0 (0,0,0) | 828 | 414 | 323 |
Drug Overdoses listed are followed by 3 numbers in parenthesis. Such as (6/4/2) The first column is NARCAN administered by Police. The Middle number is NARCAN Administered by EMS. The last number is No Treatment Indicated. Therefore, 6 NARCAN by CPD, 4 NARCAN by EMS and 2 Persons who did not require NARCAN. * Indicates data that is manually entered into the Records Management Systems and therefore may not be up to date at this time. Department Arrests will include all crimes including Part 1, as well as Vehicle and Traffic offenses and local ordinance violations.
2019 DEPARTMENT STATS
| Month | Drug Overdose | Traffic Tickets | Parking Tickets | Department Arrests |
| January | 3 (1,1,1) | 736 | 1012 | 293 |
| February | 2 (1,0,1) | 1032 | 797 | 297 |
| March | 4 (2,1,1) | 1247 | 292 | 371 |
| April | 3 (1,1,1) | 960 | 146 | 350 |
| May | 9 (1,3,5) | 959 | 119 | 325 |
| June | 3 (1,0,2) | 1035 | 103 | 296 |
| July | 8 (2,5,1) | 1216 | 60 | 293 |
| August | 6 (3,1,2) | 1198 | 114 | 349 |
| September | 4 (0,3,1) | 959 | 91 | 296 |
| October | 9 (4,5,0) | 813 | 101 | 292 |
| November | 2 (1,0,1) | 869 | 151 | 274 |
| December | 3 (0,2,1) | 530 | 237 | 282 |
Drug Overdoses listed are followed by 3 numbers in parenthesis. Such as (6/4/2) The first column is NARCAN administered by Police. The Middle number is NARCAN Administered by EMS. The last number is No Treatment Indicated. Therefore, 6 NARCAN by CPD, 4 NARCAN by EMS or Bystander and 2 Persons who did not require NARCAN. * Indicates data that is manually entered into the Records Management Systems and therefore may not be up to date at this time. Department Arrests will include all crimes including Part 1, as well as Vehicle and Traffic offenses and local ordinance violations.
2020 DEPARTMENT STATS
| Month | Drug Overdose | Traffic Tickets | Parking Tickets | Department Arrests |
| January | 3 (3,0,0) | 819 | 415 | 300 |
| February | 2 (2,0,0) | 810 | 571 | 302 |
| March | 5 (3.2.0) | 384 | 114 | 179 |
| April | 4 (3,1,0) | 198 | 54 | 99 |
| May | 8 (3,2,3) | 244 | 41 | 141 |
| June | 15 (1,8,6) | 287 | 52 | 180 |
| July | 13 (5,4,4) | 505 | 59 | 234 |
| August | 7 (1,4,2) | 758 | 63 | 273 |
| September | 7 (2,4,1) | 810 | 48 | 287 |
| October | 6 (2,1,3) | 623 | 67 | 248 |
| November | 3 (3,0,1) | 626 | 115 | 214 |
| December | 4 (2,1,1) | 318 | 633 | 153 |
Drug Overdoses listed are followed by 3 numbers in parenthesis. Such as (6/4/2) The first column is NARCAN administered by Police. The Middle number is NARCAN Administered by EMS. The last number is No Treatment Indicated. Therefore, 6 NARCAN by CPD, 4 NARCAN by EMS and 2 Persons who did not require NARCAN. * Indicates data that is manually entered into the Records Management Systems and therefore may not be up to date at this time. Department Arrests will include all crimes including Part 1, as well as Vehicle and Traffic offenses and local ordinance violations.
2021 DEPARTMENT STATS
| Month | Drug Overdose | Traffic Tickets | Parking Tickets | Department Arrests |
| January | 7 (3,3,1) | 570 | 405 | 266 |
| February | 9 (2,2,5) | 624 | 565 | 267 |
| March | 14 (5,6,3) | 672 | 89 | 289 |
| April | 10 (3,4,3) | 347 | 114 | 233 |
| May | 7 (5,1,1) | 400 | 63 | 246 |
| June | 9 (1,3,5) | 640 | 101 | 242 |
| July | 5 (1,0,4) | 848 | 49 | 248 |
| August | 9 (4,3,2) | 609 | 60 | 253 |
| September | 6 (2,3,1) | 945 | 71 | 310 |
| October | 6 (2,3,1) | 685 | 119 | 256 |
| November | 6 (4,1,1) | 805 | 132 | 238 |
| December | 5 (0,3,2) | 607 | 334 | 285 |
Drug Overdoses listed are followed by 3 numbers in parenthesis. Such as (6/4/2) The first column is NARCAN administered by Police. The Middle number is NARCAN Administered by EMS. The last number is No Treatment Indicated. Therefore, 6 NARCAN by CPD, 4 NARCAN by EMS and 2 Persons who did not require NARCAN. * Indicates data that is manually entered into the Records Management Systems and therefore may not be up to date at this time. Department Arrests will include all crimes including Part 1, as well as Vehicle and Traffic offenses and local ordinance violations.
2022 DEPARTMENT STATS
| Month | Drug Overdose | Traffic Tickets | Parking Tickets | Department Arrests |
| January | ||||
| February | ||||
| March | ||||
| April | ||||
| May | ||||
| June | ||||
| July | ||||
| August | ||||
| September | ||||
| October | ||||
| November | ||||
| December |
Drug Overdoses listed are followed by 3 numbers in parenthesis. Such as (6/4/2) The first column is NARCAN administered by Police. The Middle number is NARCAN Administered by EMS. The last number is No Treatment Indicated. Therefore, 6 NARCAN by CPD, 4 NARCAN by EMS and 2 Persons who did not require NARCAN. * Indicates data that is manually entered into the Records Management Systems and therefore may not be up to date at this time. Department Arrests will include all crimes including Part 1, as well as Vehicle and Traffic offenses and local ordinance violations.
CHEEKTOWAGA POLICE DEPARTMENT
3223 Union Road
Cheektowaga, New York 14227
Phone: (716) 686-3500
911 FOR EMERGENCIES

CHIEF BRIAN F COONS
FOLLOW US ON SOCIAL MEDIA
Copyright © 2023
Cheektowaga Police Department
All rights reserved.
CRIME
INFORMATION
CRIME INFO
CRIME REPORTS
We are pleased to provide an option to search preliminary crime information. The tool offers a search functionality, as well as unique features, insuring you receive the latest information.You will be leaving the Cheektowaga Police Department website for the following site. CrimeReports
- View crimes near an address, as well as within a specific boundary
- Select from a template of crime types
- Enhance our community-oriented policing efforts by keeping ourcitizens and business owners well informed
- View Registered Sex Offenders
- See neighboring participating cities data
- Includes iPhone application.
The tool has an alerts system that will allow residents and business owners to receive email alerts regarding recent incident activity in their desired area. The e-mail alerts contain a report outlining what type of incidents occurred, as well as when and where they occurred. The e-mail alert will also contain a link directly to the on-line mapping application that depicts the results of the requested query.
Online Accident Reports
The Cheektowaga Police Department has launched its new online system for the public to obtain motor vehicle accident reports and accident photographs. Accident reports on-line are generally available within 5 business days of the accident date.
Note: Accident photos are not taken at the scene of every accident.
For a $5.00 fee you can obtain a copy of the accident report.
Photographs are available for $4.00 a photo.
You can go direct to the site HERE
Visit our FAQ page for more information.
Additional Crime Information
The Cheektowaga Police are utilizing a web service to post crime statistics on the internet.This data is LIMITED and does not represent all crimes or reports in the area.Visit the SpotCrime Website for your neighborhood crime information.
Department Crime Stats:
NYS UCR Reports
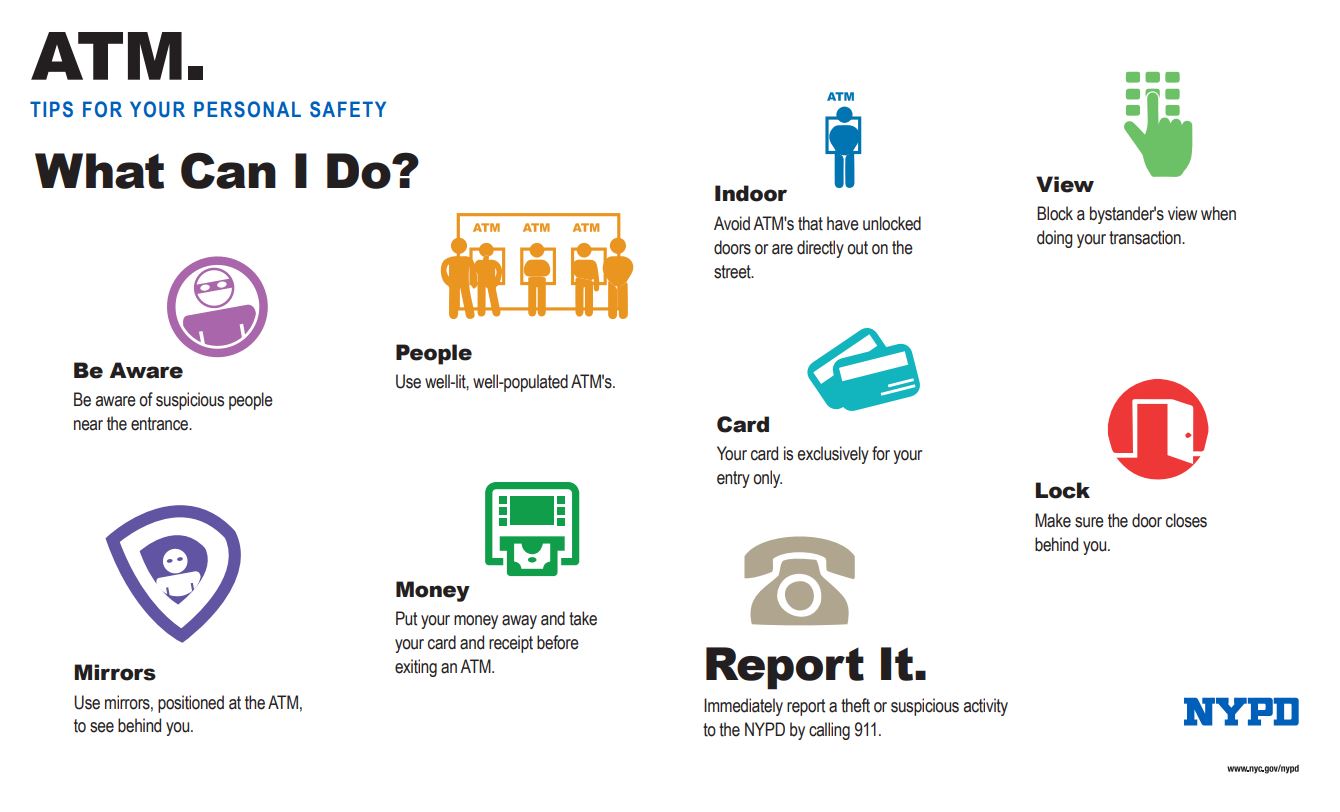
ATMs
Be Prepared
Child Safety
Disability
Domestic Violence
- Keeping your Family Safe
- How the Police Can Help
- Stalking
- Teen Dating Violence
Home/Apartment
- Babysitting Checklist
- Babysitting Safety Tips
- Facebook Marketplace
- Safeguard your house
- Safeguard your apartment
- Identity Theft
Identity Theft
Personal Safety
- File of Life
- Health Club Safety
- Phones/Social Media
- Run Safe
- Watch Your Watch
Public Transportation
- Subway and Bus
- Transit Safety
Scams/Fraud
- Chinese Phone Scams
- Green Dot Cards
- Mailbox Fishing
- Mailbox Fishing – Tax Returns
- Prepaid Gift/Debt Cards
- Rental Listing Scam
Seniors
- Keeping Seniors Safe
Vehicles/Driving
Weather-Related/Seasons
LONGTERM DEPARTMENT STATS
BUFFALO STATE USE OF FORCE
The basic arrest data for years 2009-20012 are shown below in Table 1. A Chi-square analysis of the proportion of arrests involving UOF (i.e. UOF Incidents/Total Arrests) showed that there was an overall significant difference across all four years ( χ2(3)=49.8, p < 0.001), and separate z-tests were subsequently carried out on selected pairs of proportions to determine the source of the difference. These analyses showed that there was a large decrease between 2010 and 2011 (0.030 vs. 0.015, z=5.056, p < 0.0001 one-tailed) and that decrease remained stable through 2012 (0.015 vs. 0.013, z=1.067, p > 0.05, two-tailed.) Moreover, of the two years under the new training system, the higher rate of arrests involving UOF in 2011 was also significantly lower than the smaller rate under the old system in 2009 (0.015 vs. 0.023, z = 2.984, p < 0.01, two-tailed.)
Table 1. Number and incidence of calls, arrests and UOF incidents by year
In evaluating these results, a critic might argue that the observed decrease in UOF could also be attributed to differences in the total number of arrests and/or the call volume that occurred during the years the new system was implemented. An examination of these values in Table 1 suggests that 2011 had the lowest total number of arrests of the four years under consideration, implying that the drop in UOF arrests in 2011 could simply be due to the fact that there were fewer incidents requiring an arrest. A Chi-square analysis showed that there was an overall difference in the proportion of calls leading to arrest (i.e. Total Arrests/Total Call Volume) between 2009-2012 ( χ2(3)=52.4, p < 0.001) and a follow-up z-test showed that the proportion of calls leading to arrest in 2011 was significantly lower than the next lowest rate, which occurred in 2012 (0.109 vs. 0.120, z = 5.151, p < 0.0002, two-tailed). However, the fact that the proportion of calls leading to arrest in 2012 recovered to the same level that it was in during 2009 – 2010 suggests that the unusually low number of arrests in 2011 may have been an anomaly, and that the stability of the decrease in the proportion of arrests involving UOF from 2011-2012 under the new training system, is the more important finding. The fact that 2011 had such a dramatic decline in arrests involving UOF even though it also had the largest call volume suggests that the new training system may have compensated for the added stress that the police were under in responding to incidents.
Additional support for the idea that the new training system influenced the decrease in UOF arrests can be found by examining all of the specific type of force events that had complete data over the four years under consideration, as shown below in Table 2. These results indicate that overcoming physical resistance was the most frequently used method across all four years, while personal weapon was the least common. However, these two methods were not subjected to further analysis because of two major statistical considerations: (1) Because police departments typically quantify use of force in terms of the total number of incidents in which force is needed to effect an arrest (without taking into account the number of officers and the number of different force events involved in a particular incident) overcoming physical resistance would produce several yearly proportions greater than one, and (2) personal weapon did not have enough data to support any kind of statistical test, even at an exploratory level. The resulting proportions for each force event relative to the total number of UOF incidents in that year is shown below in Table 3.
Table 2. Number of each force event used across all UOF incidents by year
** All Data in blue is NOT part of the original study, and was added after the fact using the same standards as the original study.**
In 2013, the use of force monitoring was further refined to include the category (minimal hands on) which better documents any minor use of force which required and officer to put his hands on a subject to gain compliance. An example would include grabbing a suspects arm/wrist to handcuff a subject that wasn’t complying with verbal commands.
Table 3. Proportion of each force event used relative to total UOF incidents by year
* Indicates trend was significant using a two-tailed test
A Chi-square analysis was carried out on each of these five force events and the results showed a significant difference for OC Spray ( χ2(3)=11.431, p < 0.01), pursuit of flight ( χ2(3)=19.012, p < 0.001), and compliance hold ( χ2(3)=42.293, p < 0.001), but not for baton ( χ2(3)=5.809, p = .121) or taser ( χ2(3)=7.593, p = 0.05). Given the small number of counts in many of the cells, follow-up z-tests were not performed and so the resulting trends should be viewed as preliminary in nature. However, there is at least some evidence that the use of OC Spray has decreased as a result of the new system while the use of compliance hold has increased.
–end of report summary–
2015 DEPARTMENT STATS
Year to date, CPD has had numerous “saves” from Naloxone administration. Other stats below indicate various metrics of Department activity.
Drug Overdoses listed are followed by 3 numbers in parenthesis. Such as (6/4/2) The first column is NARCAN administered by Police. The Middle number is NARCAN Administered by EMS. The last number is No Treatment Indicated. Therefore, 6 NARCAN by CPD, 4 NARCAN by EMS and 2 Persons who did not require NARCAN. * Indicates data that is manually entered into the Records Management Systems and therefore may not be up to date at this time. Department Arrests will include all crimes including Part 1, as well as Vehicle and Traffic offenses and local ordinance violations.
The Department Employment stats seen are required reporting to NYS Division of Criminal Justice Services. All NYS Agencies submit these statistics to NYS on an annual basis. The Cheektowaga Police Department runs an aggressive hiring campaign which includes reminding the general public regarding Civil Service Testing dates. As a Civil Service based agency, all Full Time hiring of Sworn Personnel requires that we follow the hiring provisions as set forth by Civil Service. For more information, please see our Employment Opportunities page.
2016 DEPARTMENT STATS
Other stats below indicate various metrics of Department activity.
Drug Overdoses listed are followed by 3 numbers in parenthesis. Such as (6/4/2) The first column is NARCAN administered by Police. The Middle number is NARCAN Administered by EMS. The last number is No Treatment Indicated. Therefore, 6 NARCAN by CPD, 4 NARCAN by EMS and 2 Persons who did not require NARCAN. * Indicates data that is manually entered into the Records Management Systems and therefore may not be up to date at this time. Department Arrests will include all crimes including Part 1, as well as Vehicle and Traffic offenses and local ordinance violations.
The Department Employment stats seen are required reporting to NYS Division of Criminal Justice Services. All NYS Agencies submit these statistics to NYS on an annual basis. The Cheektowaga Police Department runs an aggressive hiring campaign which includes reminding the general public regarding Civil Service Testing dates. As a Civil Service based agency, all Full Time hiring of Sworn Personnel requires that we follow the hiring provisions as set forth by Civil Service. For more information, please see our Employment Opportunities page.
2017 DEPARTMENT STATS
| Month | Drug Overdose | Traffic Tickets | Parking Tickets | Department Arrests |
| January | 16 (6/3/7) | 803 | 529 | 342 |
| February | 11 (3/1/7) | 919 | 185 | 338 |
| March | 13 (7/6/0) | 883 | 137 | 374 |
| April | 13 (5/6/2) | 934 | 68 | 292 |
| May | 9 (2/3/4) | 816 | 100 | 310 |
| June | 10 (6/3/1) | 988 | 92 | 360 |
| July | 9 (0/5/4) | 1003 | 108 | 355 |
| August | 6 (2/2/2) | 810 | 92 | 299 |
| September | 7 (2/2/3) | 700 | 119 | 305 |
| October | 9 (2/3/4) | 628 | 158 | 303 |
| November | 7 (2/1/4) | 806 | 201 | 303 |
| December | 1 (0/1/0) | 620 | 468 | 305 |
Drug Overdoses listed are followed by 3 numbers in parenthesis. Such as (6/4/2) The first column is NARCAN administered by Police. The Middle number is NARCAN Administered by EMS. The last number is No Treatment Indicated. Therefore, 6 NARCAN by CPD, 4 NARCAN by EMS and 2 Persons who did not require NARCAN. * Indicates data that is manually entered into the Records Management Systems and therefore may not be up to date at this time. Department Arrests will include all crimes including Part 1, as well as Vehicle and Traffic offenses and local ordinance violations.
2018 DEPARTMENT STATS
| Month | Drug Overdose | Traffic Tickets | Parking Tickets | Department Arrests |
| January | 4 (2,2,0) | 652 | 797 | 294 |
| February | 6 (1,3,2) | 776 | 564 | 257 |
| March | 8 (1,5,2) | 982 | 168 | 331 |
| April | 4 (2,2,0) | 803 | 193 | 273 |
| May | 11 (7,1,3) | 1030 | 178 | 305 |
| June | 5 (0,5,0) | 1038 | 118 | 295 |
| July | 3 (2,1,0) | 1445 | 157 | 345 |
| August | 5 (3,1,1) | 1449 | 107 | 340 |
| September | 5 (2,0,3) | 909 | 127 | 316 |
| October | 8 (3,2,3) | 911 | 191 | 298 |
| November | 2 (0,2,0) | 928 | 257 | 303 |
| December | 0 (0,0,0) | 828 | 414 | 323 |
Drug Overdoses listed are followed by 3 numbers in parenthesis. Such as (6/4/2) The first column is NARCAN administered by Police. The Middle number is NARCAN Administered by EMS. The last number is No Treatment Indicated. Therefore, 6 NARCAN by CPD, 4 NARCAN by EMS and 2 Persons who did not require NARCAN. * Indicates data that is manually entered into the Records Management Systems and therefore may not be up to date at this time. Department Arrests will include all crimes including Part 1, as well as Vehicle and Traffic offenses and local ordinance violations.
2019 DEPARTMENT STATS
| Month | Drug Overdose | Traffic Tickets | Parking Tickets | Department Arrests |
| January | 3 (1,1,1) | 736 | 1012 | 293 |
| February | 2 (1,0,1) | 1032 | 797 | 297 |
| March | 4 (2,1,1) | 1247 | 292 | 371 |
| April | 3 (1,1,1) | 960 | 146 | 350 |
| May | 9 (1,3,5) | 959 | 119 | 325 |
| June | 3 (1,0,2) | 1035 | 103 | 296 |
| July | 8 (2,5,1) | 1216 | 60 | 293 |
| August | 6 (3,1,2) | 1198 | 114 | 349 |
| September | 4 (0,3,1) | 959 | 91 | 296 |
| October | 9 (4,5,0) | 813 | 101 | 292 |
| November | 2 (1,0,1) | 869 | 151 | 274 |
| December | 3 (0,2,1) | 530 | 237 | 282 |
Drug Overdoses listed are followed by 3 numbers in parenthesis. Such as (6/4/2) The first column is NARCAN administered by Police. The Middle number is NARCAN Administered by EMS. The last number is No Treatment Indicated. Therefore, 6 NARCAN by CPD, 4 NARCAN by EMS or Bystander and 2 Persons who did not require NARCAN. * Indicates data that is manually entered into the Records Management Systems and therefore may not be up to date at this time. Department Arrests will include all crimes including Part 1, as well as Vehicle and Traffic offenses and local ordinance violations.
2020 DEPARTMENT STATS
| Month | Drug Overdose | Traffic Tickets | Parking Tickets | Department Arrests |
| January | 3 (3,0,0) | 819 | 415 | 300 |
| February | 2 (2,0,0) | 810 | 571 | 302 |
| March | 5 (3.2.0) | 384 | 114 | 179 |
| April | 4 (3,1,0) | 198 | 54 | 99 |
| May | 8 (3,2,3) | 244 | 41 | 141 |
| June | 15 (1,8,6) | 287 | 52 | 180 |
| July | 13 (5,4,4) | 505 | 59 | 234 |
| August | 7 (1,4,2) | 758 | 63 | 273 |
| September | 7 (2,4,1) | 810 | 48 | 287 |
| October | 6 (2,1,3) | 623 | 67 | 248 |
| November | 3 (3,0,1) | 626 | 115 | 214 |
| December | 4 (2,1,1) | 318 | 633 | 153 |
Drug Overdoses listed are followed by 3 numbers in parenthesis. Such as (6/4/2) The first column is NARCAN administered by Police. The Middle number is NARCAN Administered by EMS. The last number is No Treatment Indicated. Therefore, 6 NARCAN by CPD, 4 NARCAN by EMS and 2 Persons who did not require NARCAN. * Indicates data that is manually entered into the Records Management Systems and therefore may not be up to date at this time. Department Arrests will include all crimes including Part 1, as well as Vehicle and Traffic offenses and local ordinance violations.
2021 DEPARTMENT STATS
| Month | Drug Overdose | Traffic Tickets | Parking Tickets | Department Arrests |
| January | 7 (3,3,1) | 570 | 405 | 266 |
| February | 9 (2,2,5) | 624 | 565 | 267 |
| March | 14 (5,6,3) | 672 | 89 | 289 |
| April | 10 (3,4,3) | 347 | 114 | 233 |
| May | 7 (5,1,1) | 400 | 63 | 246 |
| June | 9 (1,3,5) | 640 | 101 | 242 |
| July | 5 (1,0,4) | 848 | 49 | 248 |
| August | 9 (4,3,2) | 609 | 60 | 253 |
| September | 6 (2,3,1) | 945 | 71 | 310 |
| October | 6 (2,3,1) | 685 | 119 | 256 |
| November | 6 (4,1,1) | 805 | 132 | 238 |
| December | 5 (0,3,2) | 607 | 334 | 285 |
Drug Overdoses listed are followed by 3 numbers in parenthesis. Such as (6/4/2) The first column is NARCAN administered by Police. The Middle number is NARCAN Administered by EMS. The last number is No Treatment Indicated. Therefore, 6 NARCAN by CPD, 4 NARCAN by EMS and 2 Persons who did not require NARCAN. * Indicates data that is manually entered into the Records Management Systems and therefore may not be up to date at this time. Department Arrests will include all crimes including Part 1, as well as Vehicle and Traffic offenses and local ordinance violations.
2022 DEPARTMENT STATS
| Month | Drug Overdose | Traffic Tickets | Parking Tickets | Department Arrests |
| January | ||||
| February | ||||
| March | ||||
| April | ||||
| May | ||||
| June | ||||
| July | ||||
| August | ||||
| September | ||||
| October | ||||
| November | ||||
| December |
Drug Overdoses listed are followed by 3 numbers in parenthesis. Such as (6/4/2) The first column is NARCAN administered by Police. The Middle number is NARCAN Administered by EMS. The last number is No Treatment Indicated. Therefore, 6 NARCAN by CPD, 4 NARCAN by EMS and 2 Persons who did not require NARCAN. * Indicates data that is manually entered into the Records Management Systems and therefore may not be up to date at this time. Department Arrests will include all crimes including Part 1, as well as Vehicle and Traffic offenses and local ordinance violations.
CHEEKTOWAGA POLICE DEPARTMENT
3223 Union Road
Cheektowaga, New York 14227
Phone: (716) 686-3500
911 FOR EMERGENCIES
CHIEF BRIAN F COONS
FOLLOW US ON SOCIAL MEDIA
Copyright © 2023
Cheektowaga Police Department
All rights reserved.